Viewing Your Analytics
This guide shows you how to view your analytics by signing into your account, navigating to the Analytics tab, and customizing your data view by week, month, quarter, or year. It enables you to analyze key email metrics such as sent, opened, and replied-to messages, as well as drill down into detailed campaign performance with selectable date ranges and segmentation by campaign, industry, or role.
Step-by-Step Instructions
1
Sign In
Sign into your account at app.nicest.ai to get started.
- Make sure you use your current credentials to access your account.
2
Access Analytics Overview
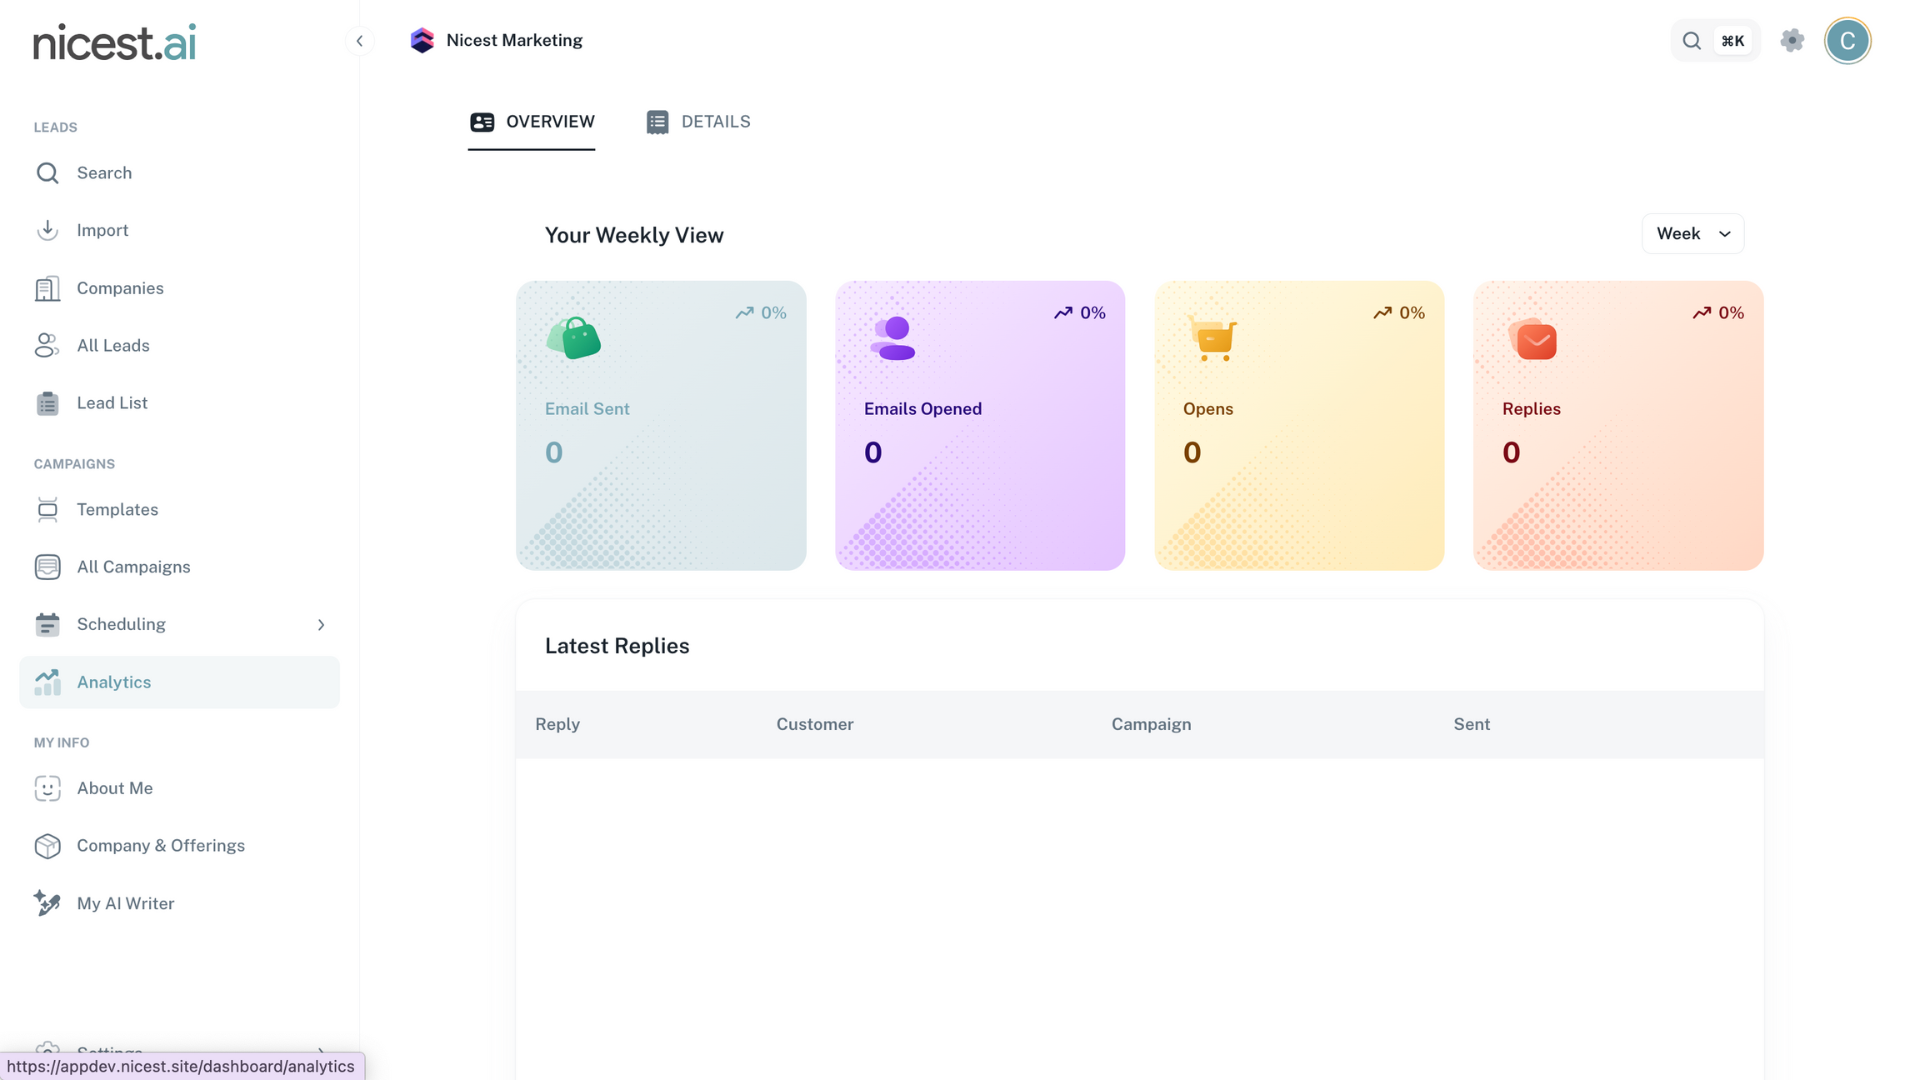
Click the Analytics tab to access your overview dashboard. Use the toggle at the top right of the dashboard to adjust the data view by Week, Month, Quarter, or Year.
- The overview displays key metrics including sent, opened, and replied-to emails.
- Quickly track email replies with an intuitive dashboard.
3
Drill Down for Details
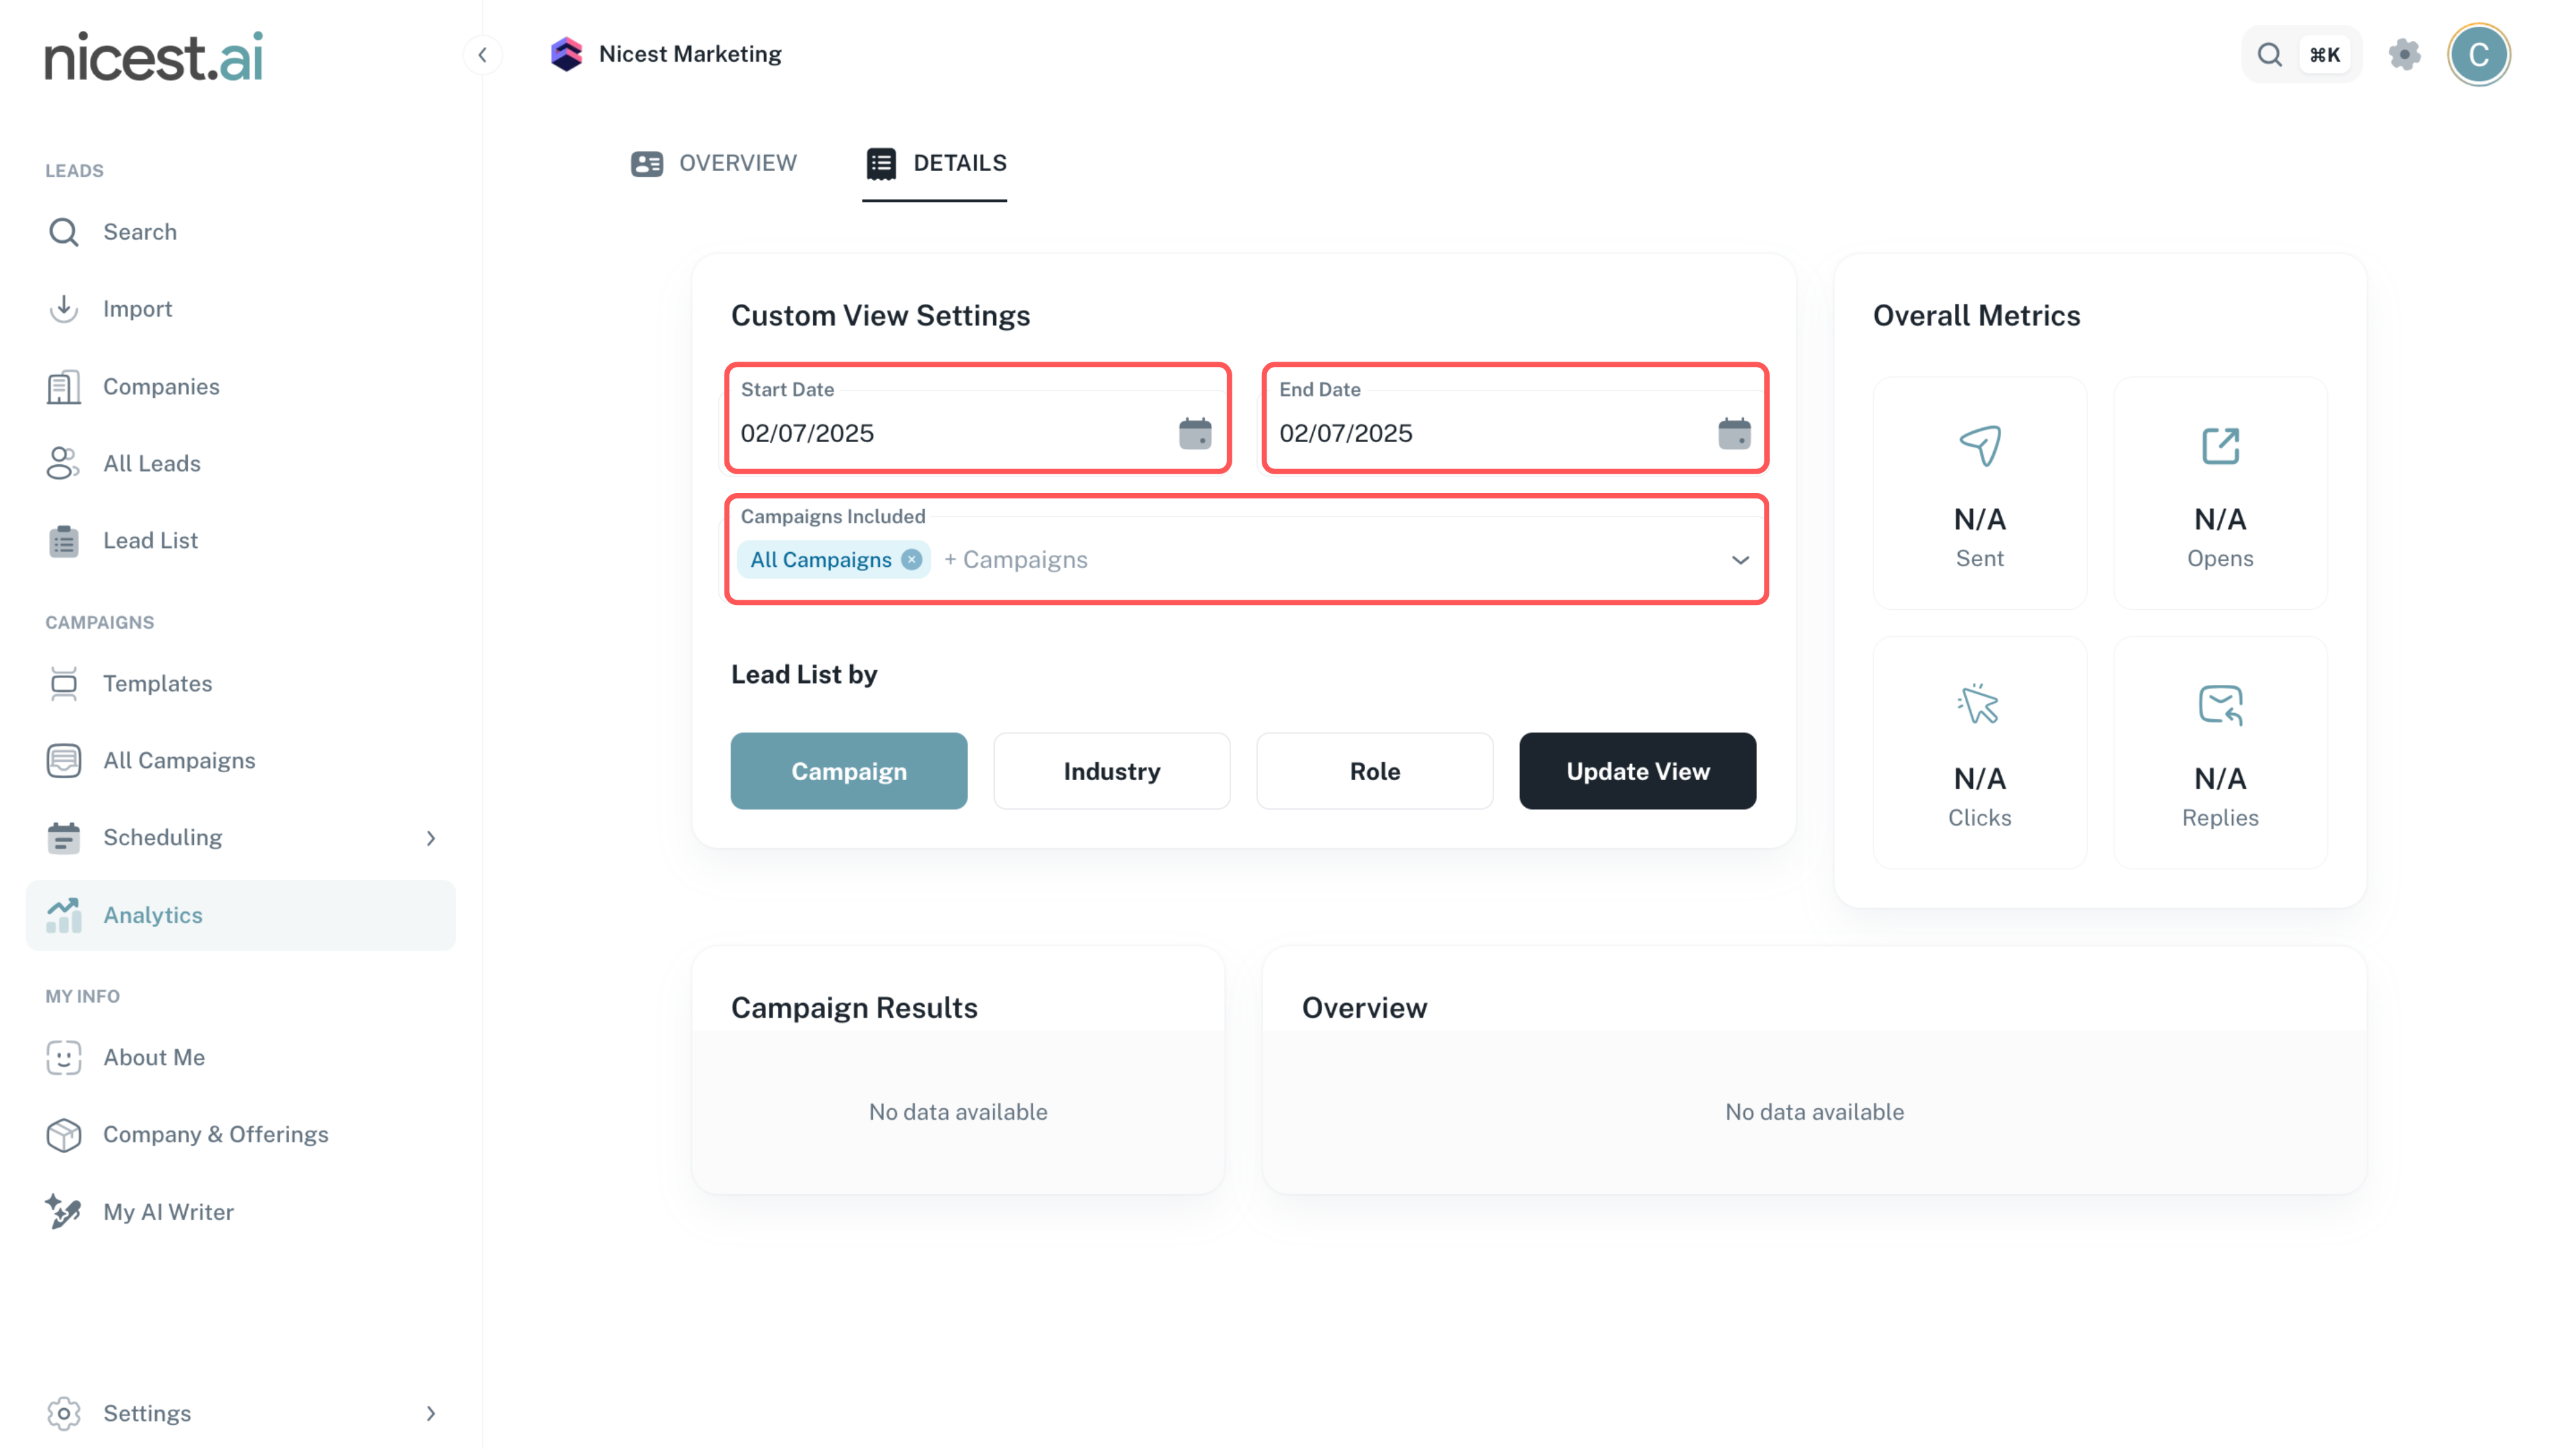
Click the Details tab located at the top left to view more granular performance data. Select a Start Date and End Date, then choose the specific campaigns you wish to review.
- Customize the date range to focus on a specific period.
- Filter results by campaign to view detailed performance metrics.
4
Segment Your Data
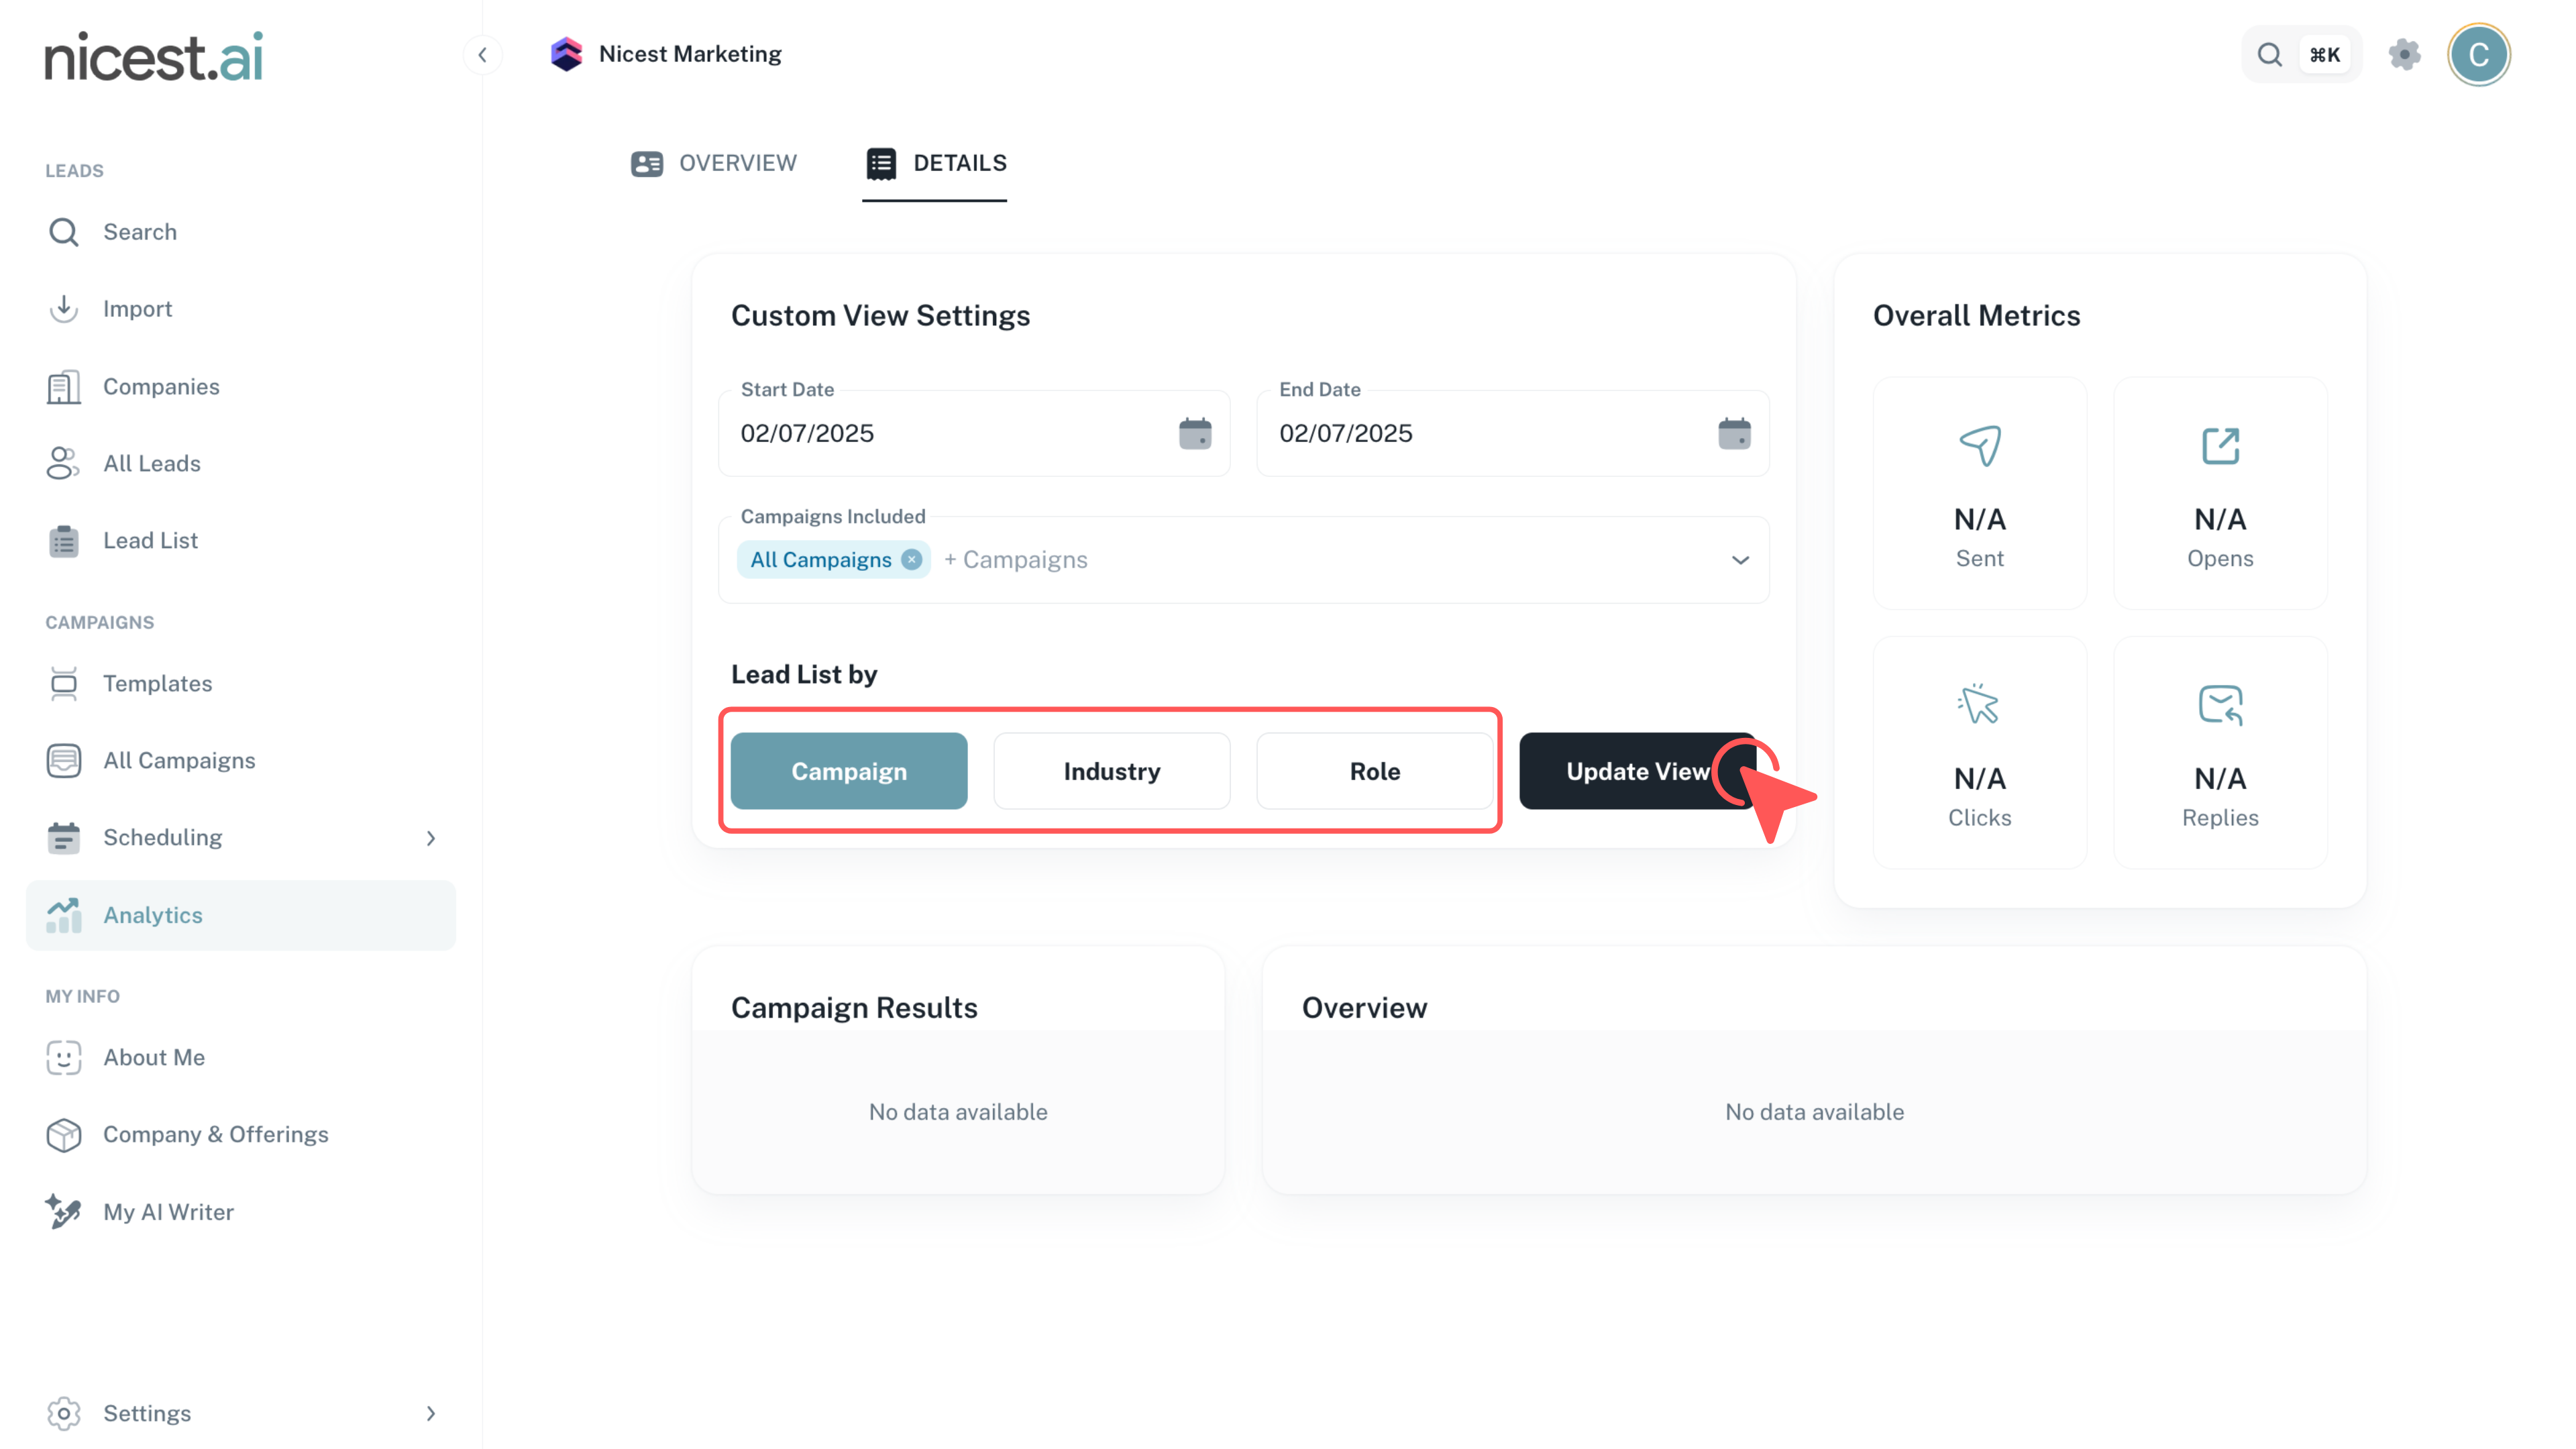
Use the segmentation options to filter data by Campaign, Industry, or Role. Click 'Update View' to refresh the graphs and charts based on your selected parameters.
- Segmentation helps you identify which segments are performing best.
- Regularly update your view to maintain current insights.